Débogueur
Le débogueur 4D est utile pour repérer les erreurs ou surveiller l'exécution des méthodes. Il vous permet d'avancer pas à pas dans le code et d'examiner les informations. Ce processus est appelé le "traçage".
Si vous avez l'habitude de coder avec VS Code, vous pouvez également utiliser cet éditeur pour déboguer le code 4D sur 4D Server après avoir installé l'extension 4D-Debugger.
Appeler le débogueur
Il existe plusieurs façons d'afficher le débogueur :
- En cliquant sur le bouton Trace dans la fenêtre des erreurs de syntaxe
- En utilisant la commande
TRACE, - En cliquant sur le bouton Debug dans la fenêtre d'exécution de méthode ou en sélectionnant le bouton Run and debug... dans l'éditeur de code
- En utilisant Alt+Shift+Clic droit (Windows) ou Ctrl+Option+Cmd+Clic (macOS) pendant l'exécution d'une méthode, puis en sélectionnant le processus à suivre dans le menu contextuel :

- En cliquant sur le bouton Trace lorsqu'un process est sélectionné dans la page Process de l'Explorateur d'exécution.
- En ajoutant un point d'arrêt dans la fenêtre de l'éditeur de code ou dans les pages Break et Catch de l'explorateur d'exécution.
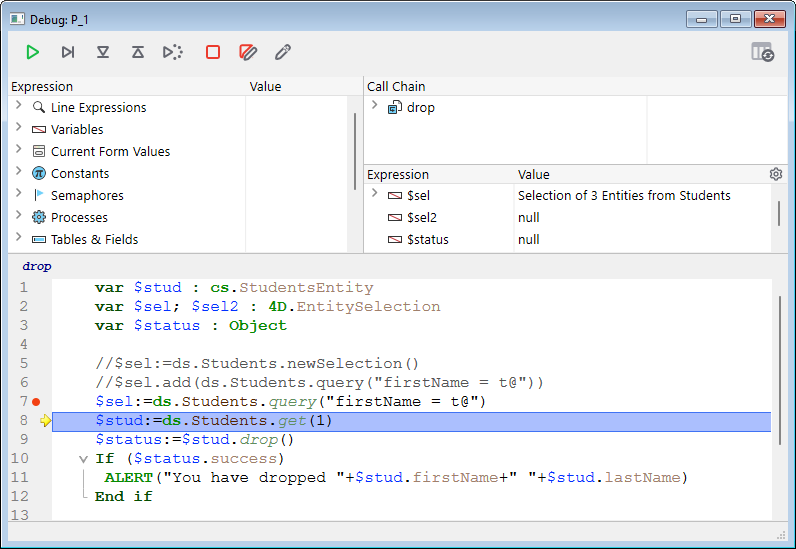
Lorsqu'il est appelé, la fenêtre du débogueur fournit le nom de la méthode ou de la fonction de classe que vous êtes en train de tracer, ainsi que l'action qui a provoqué l'apparition initiale de la fenêtre du débogueur. Par exemple, dans la fenêtre du débogueur ci-dessus :
- drop est la méthode tracée
- La fenêtre du débogueur est apparue en raison d'un point d'arrêt.
L'affichage d'une nouvelle fenêtre de débogage utilise la même configuration que la dernière fenêtre affichée dans la même session. Si vous exécutez plusieurs process utilisateur, vous pouvez les tracer indépendamment et avoir une fenêtre de débogage ouverte pour chaque process.
La fenêtre du débogueur est généralement affichée sur la machine où le code est exécuté. Avec une application mono-utilisateur, elle est toujours affichée sur la machine qui exécute l'application. Avec une application client/serveur, elle est affichée :
- sur le 4D distant pour le code s'exécutant localement
- sur la machine du serveur pour le code exécuté sur le serveur (par exemple, une méthode avec l'option Exécuter sur serveur).
- Si le serveur fonctionne en mode headless, aucune fenêtre de débogage ne peut être affichée sur le serveur, vous devez utiliser le débogueur distant. Voir Débogage depuis des machines distantes.
- Vous pouvez également attacher le débogueur Qodly Studio à une application 4D Server si vous devez déboguer des pages Qodly dans un environnement déployé.
Boutons de la barre d'outils
La barre d'outils du débogueur comprend plusieurs boutons, associés aux raccourcis par défaut :
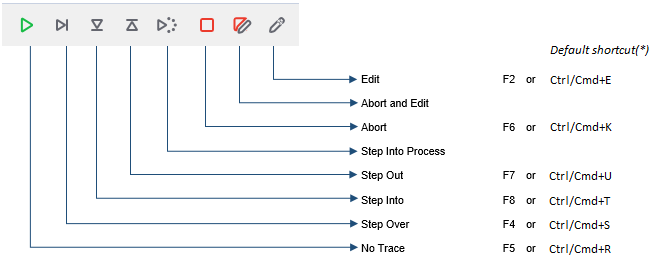
Les raccourcis par défaut peuvent être personnalisés dans la Page des raccourcis de la boîte de dialogue Préférences.
Reprendre exécution
Arrêt du mode Trace et reprise du cours normal de l’exécution de la méthode.
Maj + F5 ou Maj + en cliquant sur le bouton No Trace reprend l'exécution. avec désactivation de tous les appels à TRACE suivants dans le process courant.
Exécuter pas à pas
Exécute la ligne de méthode en cours, indiquée par le compteur de programme (la flèche jaune). Le débogueur passe à la ligne suivante.
Le bouton Exécuter pas à pas ne passe pas dans les sous-routines et les fonctions. Il reste au niveau de la méthode que vous êtes en train de tracer. Si vous souhaitez également tracer les appels aux sous-routines et aux fonctions, utilisez le bouton Pas à pas détaillé.
Dans le débogage distant, lors de l'exécution de la méthode sur le serveur, la méthode parente est appelée après l'exécution de la dernière ligne de méthode enfant. Si la méthode parente est exécutée du côté distant, le bouton Exécuter pas à pas a le même effet que le bouton No Trace.
Exécuter pas à pas détaillé
Lors de l’exécution d’une ligne qui appelle une autre méthode (sous-routine ou fonction), ce bouton provoque l’affichage de la méthode appelée dans la fenêtre du débogueur, et permet au développeur de passer pas à pas dans cette méthode.
La nouvelle méthode devient la méthode courante (en haut) dans le fenêtre de chaine d'appel du Débogueur.
Lors de l'exécution d'une ligne qui n'appelle pas une autre méthode, ce bouton a le même effet que le bouton Exécuter pas à pas.
Exécuter et sortir
Si vous tracez des sous-programmes et des fonctions, un clic sur ce bouton vous permet d'exécuter l'intégralité de la méthode en cours de traçage et de revenir à la méthode de l'appelant. La fenêtre du débogueur est ramenée à la méthode précédente dans la chaîne d'appels. Si la méthode courante est la dernière méthode de la chaîne d’appel, la fenêtre du débogueur se referme.
En débogage distant, lors de l'exécution de la dernière ligne de la méthode, si la méthode est exécutée sur le serveur, la méthode parente est appelée. Si la méthode parente est exécutée côté distant, le bouton agit de la même manière que le bouton Reprendre exécution.
Pas à pas nouveau process
Lors de l’exécution d’une ligne qui crée un nouveau process (par exemple qui appelle la commande New process), ce bouton ouvre une nouvelle fenêtre du débogueur qui vous permet de tracer la méthode de gestion du process que vous venez de créer. Lors de l’exécution d’une ligne qui ne crée pas de nouveau process, ce bouton se comporte comme le bouton Exécuter pas à pas.
Stopper exécution
La méthode s’arrête et vous retournez là où vous étiez avant son exécution :
- Si vous tracez une méthode formulaire ou une méthode objet s’exécutant en réponse à un événement, elle s’arrête et vous retournez au formulaire.
- Si vous tracez une méthode s’exécutant à partir du mode Application, vous retournez à ce mode.
Stopper et éditer
La méthode qui s'exécute lorsque vous cliquez sur ce bouton s'ouvre dans l'éditeur de code.
Conseil : Utilisez ce bouton lorsque vous connaissez les modifications à apporter à votre code, et le moment où elles doivent être effectuées pour pouvoir poursuivre le test de vos méthodes. Une fois vos modifications effectuées, ré-exécutez la méthode.
Editer méthode
La méthode qui s'exécute au moment où vous cliquez sur le bouton Éditer s'ouvre dans l'éditeur de méthode.
Si vous utilisez ce bouton pour modifier une méthode, les modifications ne seront effectives que la prochaine fois qu'elle sera exécutée.
Conseil: Utilisez ce bouton lorsque vous savez quelles modifications sont nécessaires dans votre code et qu'elles n'interfèrent pas avec le reste du code à exécuter ou à tracer.
Sauvegarde automatique
L'état courant de la fenêtre du débogueur est automatiquement enregistré dans le projet. Cela inclut :
- la taille et la position de la fenêtre,
- la position des lignes de division,
- le mode affichage,
- les expressions actuellement affichées dans le volet des expressions personnalisées. Par défaut, les expressions sont enregistrées avec la méthode ou la fonction en courante. Vous pouvez épingler une expression pour qu'elle reste affichée dans tous les contextes.
Le bouton Configuration par défaut de la fenêtre rétablit la position et la taille par défaut de la fenêtre courante (y compris les lignes de division et la fenêtre elle-même).
![]()
Fenêtre d'expression
La Fenêtre d’expression est située en haut à gauche de la fenêtre du débogueur, sous la barre d’outils de contrôle d’exécution. Voici un exemple :
Ce volet n'est pas disponible en mode débogage à distance.
La Fenêtre d’expression affiche toutes les informations générales utiles sur l'environnement 4D et l’environnement d'exécution.
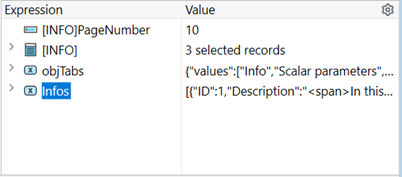
La colonne Expression affiche les noms des objets et des expressions. La colonne Valeur affiche les valeurs courantes correspondantes. Cliquer sur n'importe quelle valeur sur le côté droit du panneau vous permet de modifier la valeur de l'objet, si cela est autorisé pour cet objet.
À tout moment, vous pouvez glisser déposer des thèmes, des sous-listes de thèmes (le cas échéant) et des éléments de thème vers la Fenêtre d'évaluation.
Liste Expression
Expressions courantes
Ce thème vous permet de suivre les valeurs des expressions :
- utilisé(e) s dans la ligne de code à exécuter (celle qui est indiquée par le compteur de programme — la flèche jaune dans la Fenêtre d'évaluation du code),
- utilisé(e) s dans la ligne de code précédente
Comme la ligne de code précédente est celle qui a été exécutée avant, ce thème montre donc les objets ou expressions de la ligne courante avant et après que la ligne ait été exécutée. Imaginons que vous exécutiez la méthode suivante :
TRACE
$a:=1
$b:=a+1
$c:=a+b
-
Une fenêtre de débogage s'ouvre avec le compteur de programme défini à la ligne avec
a:=1. À ce stade, le thème Objets courants affiche :$a Undefined La variable
$an'est pas encore initialisée, mais elle est affichée parce qu'elle est utilisée dans la ligne à exécuter. -
Vous cliquez sur le bouton Exécuter pas à pas. Le compteur du programme est maintenant défini sur la ligne
b:=a+1. À ce stade, le thème Objets courants affiche :$a 1 $b Undefined La valeur de la variable
$aest maintenant 1. La variable$bn'est pas encore initialisée, mais elle est affichée parce qu'elle est utilisée dans la ligne à exécuter. -
Vous cliquez à nouveau sur le bouton Exécuter pas à pas. Le compteur de programme est maintenant placé sur la ligne avec $c:=a+b. Le thème Objets courants affiche :
$c Undefined $a 1 $b 2 La valeur de la variable
$best maintenant 2. La variable$cn'est pas encore initialisée, mais elle est affichée parce qu'elle est utilisée dans la ligne à exécuter.
Variables
Ce thème est composé des sous-thèmes suivants :
| Sous-thème | Description | Peut-on modifier les valeurs ? |
|---|---|---|
| Interprocess | Liste des variables interprocess utilisées à ce stade | Oui |
| Process | Liste des variables process utilisées par le process courant | Oui |
| Local | Liste des variables locales utilisées par la méthode en cours de traçage | Oui |
| Paramètres | Liste des paramètres reçus par la méthode | Oui |
| Self | Pointeur vers l'objet courant, lors du traçage d'une méthode objet | Non |
Les tableaux, comme les autres variables, apparaissent dans les sous-thèmes interprocess, process et local, selon leur portée. Le débogueur affiche les 100 premiers éléments. À l'intérieur de la colonne Valeur, vous pouvez modifier les valeurs des éléments des tableaux, mais pas la taille des tableaux.
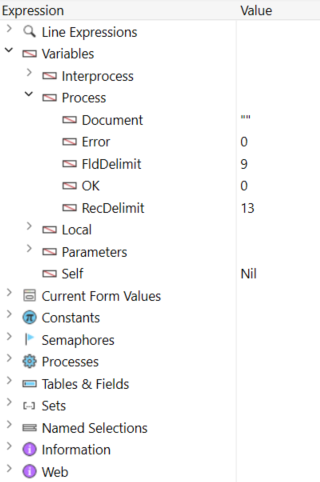
Pour afficher les types de variables et leurs noms internes, faites un clic droit et cochez l'option Afficher les types dans le menu contextuel :

Voici le résultat :
![]()
Valeurs du formulaire courant
Ce thème contient le nom de chaque objet dynamique inclus dans le formulaire courant, ainsi que la valeur de sa variable associée :

Certains objets, tels que les list box tableaux, peuvent être présentés comme deux objets distincts, la variable de l'objet lui-même et sa source de données.
Constantes
Comme la page Constantes de la fenêtre de l'Explorateur, ce thème affiche des constantes prédéfinies fournies par 4D. Les expressions de ce thème ne peuvent pas être modifiées.
Sémaphores
Ce thème liste les sémaphores locaux définis. Pour chaque sémaphore, la colonne Valeur fournit le nom du process qui a posé le sémaphore. Les expressions de ce thème ne peuvent pas être modifiées. Les expressions de ce thème ne peuvent pas être modifiées.
Process
Ce thème liste les process démarrés depuis le début de la session de travail. La colonne de valeur affiche le temps utilisé et l'état courant pour chaque process (Exécution, Pause, etc.). Les expressions de ce thème ne peuvent pas être modifiées.
Tables et champs
Ce thème répertorie les tables et les champs dans la base de données 4D. Pour chaque élément de table, la colonne Valeur affiche la taille de la sélection courante pour le process courant ainsi que le nombre d'enregistrements verrouillés.
Pour chaque champ, la colonne Valeur affiche la valeur du champ pour l'enregistrement courant (sauf image et BLOB). Vous pouvez modifier les valeurs des champs, mais pas les informations des tables.
Ensembles
Ce thème liste les ensembles définis dans le process courant (celui que vous tracez actuellement) et les ensembles interprocess. Pour chaque ensemble, la colonne Valeur affiche le nombre d'enregistrements et le nom de la table. Les expressions de ce thème ne peuvent pas être modifiées.
Sélections temporaires
Ce thème répertorie les sélections temporaires qui sont définies dans le process courant (celui que vous tracez actuellement) ; il répertorie également les sélections temporaires interprocess. Pour chaque sélection temporaire, la colonne Valeur affiche le nombre d'enregistrements et le nom de la table. Les expressions de ce thème ne peuvent pas être modifiées.
Informations
Ce thème contient des informations générales sur les opérations de base de données, telles que la table par défaut courante (si elle existe), l'espace de mémoire physique, virtuel, libre et utilisée, la destination des requêtes, etc.
Web
Ce thème affiche des informations concernant le serveur Web principal de l'application (disponible uniquement si le serveur Web est actif) :
- Fichier Web à envoyer : nom du fichier Web en attente d'envoi (le cas échéant)
- Occupation du cache Web : nombre de pages présentes dans le cache Web ainsi que le pourcentage d'utilisation
- Temps d’activité du serveur Web : durée d'utilisation du serveur Web au format heures:minutes:secondes
- Nombre de requêtes http : nombre total de requêtes HTTP reçues depuis le lancement du serveur web, ainsi que le nombre instantané de requêtes par seconde
- Nombre de process Web actifs : nombre de process Web actifs, tous process Web confondus
Les expressions contenues dans ce thème ne peuvent pas être modifiées.
Menu contextuel
Le menu contextuel de la fenêtre d’expression vous propose des options supplémentaires.
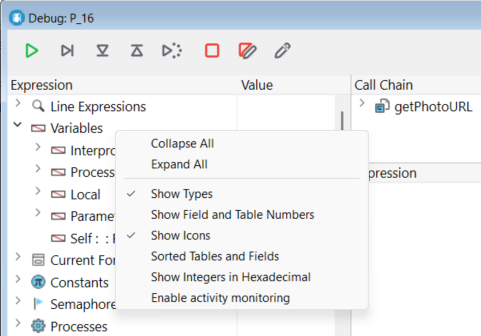
- Déployer : Déploie tous les niveaux de la liste hiérarchique des expressions.
- Contracter : Contracte tous les niveaux de la liste hiérarchique des expressions.
- Montrer les types : Lorsque vous sélectionnez cette option, le type de l’objet s’affiche (lorsque cela est pertinent).
- Montrer le numéro de champ et de table : Affiche le numéro des tables ou de champs. Utile si vous travaillez avec les numéros de table ou de champ, ou avec des pointeurs en utilisant des commandes telles que
TableouField. - Montrer les icônes : Chaque objet est précédé d'une icône qui indique son type. Vous pouvez désactiver cette option pour accélérer l’affichage, ou tout simplement parce que l’option Montrer les types vous convient.
- Tables et champs triés : Cette option force les tables et les champs à s’afficher par ordre alphabétique (dans leurs listes respectives).
- Afficher les entiers en hexadécimal : Les nombres s’affichent en notation décimale. Sélectionnez cette option pour les afficher en hexadécimal. Note : Pour exprimer une valeur numérique en hexadécimal, saisissez 0x (zéro + "x") puis les caractères hexadécimaux.
- Activer le suivi d'activité : Active le suivi d'activité (contrôle avancé de l'activité interne de l'application) et affiche les informations collectées dans des thèmes supplémentaires : Séquenceur, Web et Réseau.
Fenêtre chaîne d'appel
Une méthode peut appeler d'autres méthodes ou fonctions de classe, qui peuvent à leur tour appeler d'autres méthodes ou fonctions. Le volet Chaîne d'appels vous permet de suivre cette hiérarchie.

Chaque élément de niveau principal est le nom d'une méthode ou d'une fonction de classe. L'élément supérieur est celui que vous tracez actuellement, l'élément de niveau principal suivant est le nom de l'appelant (la méthode ou la fonction qui a appelé celle que vous tracez actuellement), le suivant est l'appelant de l'appelant, et ainsi de suite.
Dans l'image ci-dessus :
thirdMethodn'a reçu aucun paramètre$0est actuellement indéfini, car la méthode n'a pas attribué de valeur à$0(parce qu'elle n'a pas encore exécuté cette assignation ou parce que la méthode est une sous-routine et non une fonction)secondMethoda reçu trois paramètres defirstMethod:- $1 est un pointeur vers la table
[Employee] - $2 est un pointeur vers le champ
IDdans la table[Employee] - $3 est un paramètre alphanumérique dont la valeur est "Z"
- $1 est un pointeur vers la table
Vous pouvez double-cliquer sur le nom de n'importe quelle méthode pour afficher son contenu dans le Fenêtre d'évaluation des méthodes.
En cliquant sur l'icône à côté d'un nom de méthode ou de fonction, vous pouvez développer ou replier les paramètres et le résultat (le cas échéant). Les valeurs apparaissent sur le côté droit du volet. En cliquant sur n'importe quelle valeur du côté droit, vous pouvez modifier la valeur de n'importe quel paramètre ou résultat de fonction.
Pour afficher le type de paramètre, cochez l'option Afficher les types dans le menu contextuel :

Après avoir déployé la liste des paramètres, vous pouvez faire glisser et déposer les paramètres et les résultats de la fonction dans la fenêtre d'évaluation.
Vous pouvez également utiliser la commande Call chain pour récupérer la chaîne d'appels par programmation.
Fenêtre d'évaluation
Le fenêtre d'évaluation sert à évaluer les expressions. Elle est similaire à la fenêtre d'expression, sauf que vous décidez quelles expressions sont affichées. Tout type d'expression peut être évalué :
- variable
- objet et propriété d'objet
- champ
- pointer
- calcul
- commande 4D
- method
- et tout ce qui renvoie une valeur
Vous pouvez évaluer toute expression qui peut être affichée sous forme de texte. Ceci n'inclut pas les champs et les variables image et BLOB. Pour afficher le contenu d'un BLOB, vous pouvez utiliser les commandes BLOB, telles que BLOB to text.
Mode d'affichage
Vous sélectionnez le mode d'affichage à utiliser pour toutes les fenêtres du débogueur en utilisant l'option Affichage du menu contextuel de la fenêtre d'évaluation.
Les options suivantes sont disponibles :
- Variables locales : Affiche et évalue automatiquement les variables locales dès qu'elles sont initialisées dans le code source en cours d'exécution.
- Expressions courantes : Affiche et évalue automatiquement le même contenu que l'élément Expressions courantes de la liste Expression.
- Expressions : Affiche uniquement les expressions personnalisées que vous avez saisies manuellement. Les expressions personnalisées ont une icône bleue spécifique
 .
.
Quel que soit le mode d'affichage, vous pouvez ajouter des expressions personnalisées à tout moment.
Gestion des expressions
Vous pouvez saisir n'importe quelle expression à évaluer. Une expression personnalisée n'est affichée que dans la fenêtre courante du débogueur, sauf si vous l'épinglez.
Il y a plusieurs façons d'ajouter des expressions à la liste :
- Glisser et déposer un objet ou une expression depuis la fenêtre d'expression ou la fenêtre de chaîne d'appel
- Sélectionner une expression dans le volet source et appuyer sur ctrl+D (Windows) ou cmd+D (macOS)
- Double-cliquer quelque part dans l'espace vide du volet (ajoute une expression avec un nom de paramètre fictif que vous pouvez modifier)
- Sélectionner une option d'affichage qui insère automatiquement des expressions.
- Sélectionnez Nouvelle expression... dans le menu contextuel de la fenêtre d'évaluation pour ajouter une expression à l'aide de l'Éditeur de formules. Vous pouvez entrer n'importe quelle formule qui renvoie un résultat.
Pour modifier une expression, cliquez dessus pour la sélectionner, puis cliquez à nouveau ou appuyez sur Enter sur votre clavier.
Pour supprimer une expression personnalisée, cliquez dessus pour la sélectionner, puis appuyez sur Retour arrière ou Suppr sur votre clavier, ou cliquez sur l'icône x.
Soyez prudent lorsque vous évaluez une expression 4D modifiant la valeur d'une des variables système (par exemple, la variable OK) car l'exécution du reste de la méthode peut être altérée.
Épingler une expression
Vous pouvez cliquer sur l'icône de la punaise pour épingler une expression :

L'expression sera alors affichée dans toutes les fenêtres du débogueur.
Menu contextuel
Le menu de la fenêtre d'évaluation est accessible via un clic contextuel ou en utilisant l'icône ![]() :
:
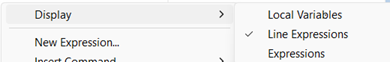
- Affichage : Sélectionne le mode d'affichage à utiliser pour toutes les fenêtres du débogueur.
- Nouvelle expression : insère une nouvelle expression et affiche l'Éditeur de formules 4D.
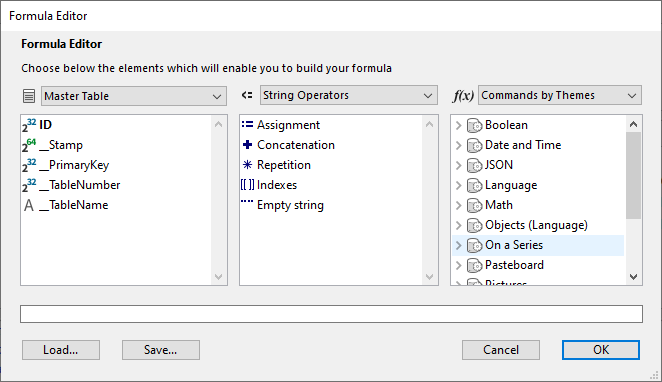 Pour plus d'informations sur l'éditeur de formules, voir le manuel Mode développement.
- Insérer une commande... : Affiche un menu permettant d'insérer une commande 4D en tant que nouvelle expression.
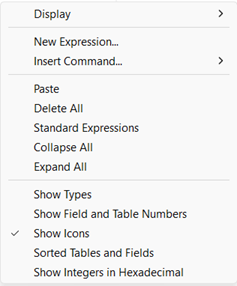
- Supprimer tout : Supprime toutes les expressions de la fenêtre d"évaluation.
- Expressions standard : Copie la liste des expressions de la fenêtre d'évaluation en tant qu'expressions personnalisées.
Cette option n'est pas disponible en mode débogueur distant.
- Contracter tout/Développer tout : Contracte ou développe toutes les listes hiérarchiques.
- Montrer les types : Affiche le type de chaque élément dans la liste (lorsque cela est pertinent).
- Montrer le numéro de champ et de table : Affiche le numéro des tables ou de champs. Utile si vous travaillez avec des numéros de table ou de champs, ou avec des pointeurs utilisant les commandes
TableouChamp. - Montrer les icônes : Chaque objet est précédé d'une icône qui indique son type.
- Tables et champs triés : Affiche la table et les champs par ordre alphabétique.
- Afficher les entiers en hexadécimal : Affiche les nombres en utilisant la notation hexadécimale. Pour entrer une valeur numérique en hexadécimal, tapez 0x (zéro + "x"), suivi des chiffres hexadécimaux.
Fenêtre d'évaluation du code
Ce panneau affiche le code source de la méthode ou de la fonction en cours de traçage.
Cette zone vous permet également d'ajouter ou de supprimer des points d'arrêt.
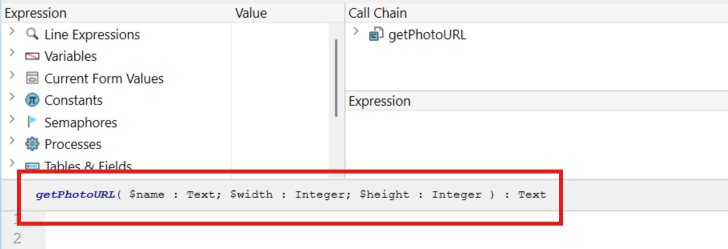
Prototype
Le prototype de la méthode ou de la fonction en cours d'exécution dans la chaîne d'appels est affiché en haut du volet :
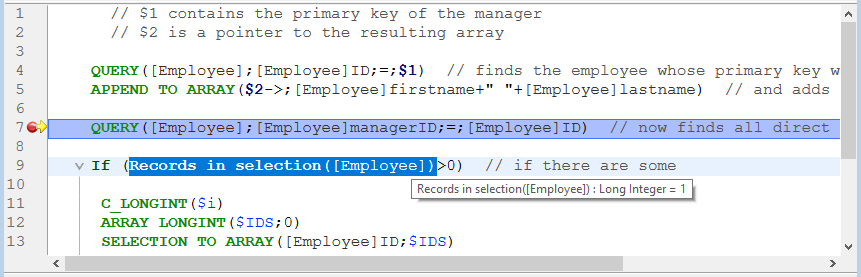
Infobulle
Passez votre pointeur sur une expression pour afficher une info-bulle qui indique :
- le type déclaré de l'expression
- la valeur courante de l'expression
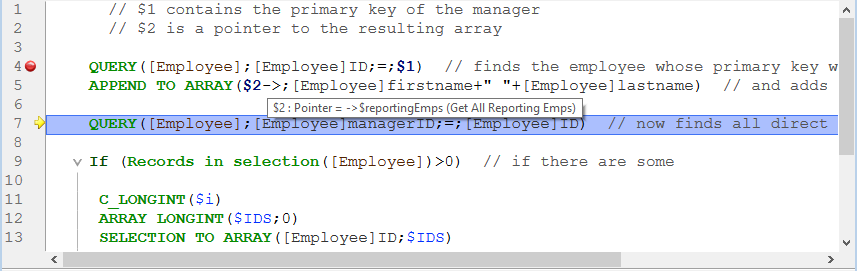
Cela fonctionne également avec les sélections :
Ajout d'expressions à la fenêtre d'évaluation
Vous pouvez copier n'importe quelle expression sélectionnée depuis la fenêtre de code source vers la fenêtre d'évaluation.
- Dans le volet Code Source, sélectionnez l'expression à évaluer
- Effectuez l'une des opérations suivantes :
- Glissez et déposez le texte sélectionné dans la zone d'expression
- Appuyez sur Ctrl+D (Windows) ou Cmd+D (macOS)
- Cliquez avec le bouton droit sur le texte sélectionné > Copier dans la fenêtre d'expression
Compteur de programme
La flèche jaune située dans la marge gauche de la fenêtre du code source s'appelle le compteur de programme. Elle marque la prochaine ligne à exécuter.
Par défaut, la ligne du compteur de programme (également appelée ligne d'exécution) est mise en évidence dans le débogueur. Vous pouvez personnaliser la couleur de surbrillance dans la page Méthodes des Préférences.
Déplacer le compteur de programme
À des fins de débogage, vous pouvez déplacer le compteur de programme de la méthode située au sommet de la chaîne d'appels (la méthode en cours d'exécution). Pour ce faire, cliquez et faites glisser la flèche jaune vers une autre ligne.
Cela indique seulement au débogueur de poursuivre le traçage ou l'exécution à partir d'un point différent. Il n'exécute pas les lignes et n'annule pas leur exécution. Tous les paramètres, champs, variables, etc. courants ne sont pas affectés.
Par exemple :
  // ...
 If(This condition)
    DO_SOMETHING
 Else
    DO_SOMETHING_ELSE
 End if
  // ...
Considérons que le compteur de programme est défini sur la ligne If (This condition).
Lorsque vous cliquez sur le bouton Exécuter pas à pas , le compteur du programme passe directement à la ligne DO_SOMETHING_ELSE .
Pour examiner les résultats de la ligne DO_SOMETHING , vous pouvez déplacer le compteur de programme sur cette ligne et l'exécuter.
Menu contexuel
Le menu contextuel de la Fenêtre d'évaluation du code donne accès à plusieurs fonctions utiles en phase d’exécution du code en mode Trace :
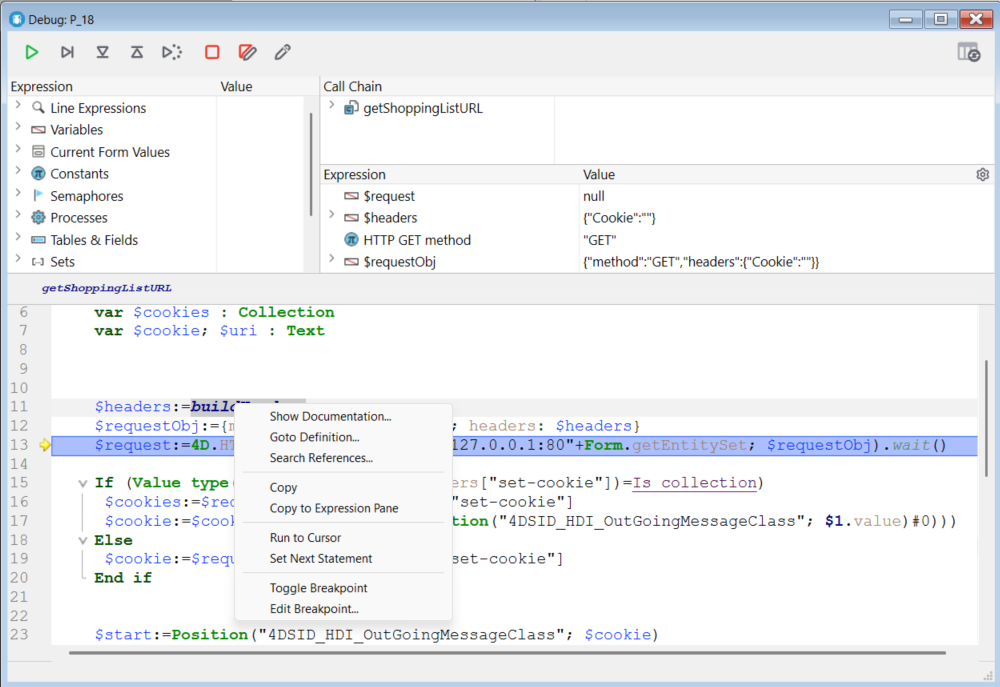
- Montrer la documentation : Ouvre la documentation de l'élément cible. Cette commande est disponible avec les objets suivants :
- méthodes projet, classes utilisateurs : Sélectionne la méthode dans l'explorateur et passe à l'onglet documentation
- Commandes 4D, fonctions, noms de classe: Affiche la documentation en ligne.
- Chercher les références (cette fonction est également accessible depuis l’Editeur de code) : rechercher tous le projet (méthodes et formulaires) dans lesquels l’élément courant de la méthode est référencé. L’élément courant est l’élément sélectionné ou l’élément dans lequel se trouve le curseur. Il peut s’agir d’un nom de champ, de variable, de commande, d’une chaîne, etc. Le résultat de la recherche est affiché dans une nouvelle fenêtre de résultat standard.
- Copier : copie standard de l'expression sélectionnée dans le conteneur de données.
- Copier dans la fenêtre d'expression : copie l'expression sélectionnée dans la Fenêtre d'évaluation.
- Exécuter jusqu’au curseur : provoque l’exécution des instructions situées entre le compteur de programme (flèche jaune) et la ligne sélectionnée de la méthode (dans laquelle se trouve le curseur).
- Fixer prochaine instruction : déplace le compteur de programme jusqu’à la ligne sélectionnée sans l’exécuter et sans exécuter les lignes intermédiaires. La ligne désignée ne sera exécutée que si l’utilisateur clique sur l’un des boutons d’exécution.
- Permuter point d’arrêt (également accessible depuis l’Editeur de code) : permet alternativement d’insérer ou de supprimer le point d’arrêt correspondant la ligne sélectionnée. Cette fonction modifie le point d’arrêt de façon permanente : par exemple, un point d’arrêt supprimé dans le débogueur n’apparaît plus dans la méthode d’origine.
- Modifier point d’arrêt... (également accessible depuis l’Editeur de code) : permet d’afficher la boîte de dialogue des Propriétés du point d’arrêt. Cette fonction modifie le point d’arrêt de façon permanente.
Chercher Suivant/Précédent
Des raccourcis spécifiques permettent de trouver des chaînes de caractères identiques à celle qui est sélectionnée :
- Pour rechercher les prochaines chaînes identiques, appuyez sur Ctrl+E (Windows) ou Cmd+E (macOS)
- Pour rechercher les chaînes identiques précédentes, appuyez sur Ctrl+Shift+E (Windows) ou Cmd+Shift+E (macOS)
La recherche s'effectue uniquement si vous sélectionnez au moins un caractère dans le volet Code source.
Raccourcis
Cette section répertorie tous les raccourcis disponibles dans la fenêtre du débogueur.
La barre d'outils comporte également des raccourcis.
Fenêtre d'évaluation & Sous-fenêtre d’évaluation
- Un double-clic sur un article de la fenêtre d’expression copie cet article dans la fenêtre d’évaluation
- Un double-clic dans la sous-fenêtre d’évaluation crée une nouvelle expression
Fenêtre d'évaluation du code
- Un clic dans la marge gauche place ou supprime un point d’arrêt.
- Alt+Majuscule+clic (Windows) ou Option+Majuscule+clic (macOS) pose un point d’arrêt provisoire.
- Alt+clic (Windows) ou Option+clic (macOS) affiche la fenêtre des propriétés du point d’arrêt pour un point d’arrêt nouveau ou existant.
- Une expression ou un objet sélectionné(e) peut être copié(e) dans la Fenêtre d'évaluation par glisser-déposer.
- Ctrl+D (Windows) ou Commande+D (macOS) sur un texte sélectionné le copie dans la Fenêtre d'évaluation.
- Ctrl+E (Windows) ou Commande+E (macOS) identifie les chaînes suivantes qui sont identiques à la chaîne sélectionnée.
- Ctrl+Majuscule+E (Windows) ou Commande+Majuscule+E (macOS) identifie les chaînes précédentes qui sont identiques à la chaîne sélectionnée.
Toutes les fenêtres
- Ctrl + +/- (Windows) ou Commande + +/- (macOS) augmente ou réduit la taille de la police pour une meilleure lisibilité. La taille de la police modifiée s'applique également à l'Editeur de code et est stockée dans les Préférences.
- Ctrl+(Windows) ou Commande+ (macOS) force la réactualisation de la Fenêtre d'expression.
- Lorsqu'aucun objet n’est sélectionné dans les fenêtres, en appuyant sur Entrée, vous avancez d’une ligne.
- Lorsque la valeur d’un élément est sélectionnée, utilisez les touches directionnelles pour naviguer dans la liste.
- Lorsque vous êtes en train d’éditer un élément, utilisez les touches directionnelles pour déplacer le curseur. Utilisez Ctrl+A/X/C/V (Windows) ou Commande+A/X/C/V (macOS) en raccourci des commandes du menu Edition : Tout Sélectionner/Couper/Copier/Coller.