Página Monitor
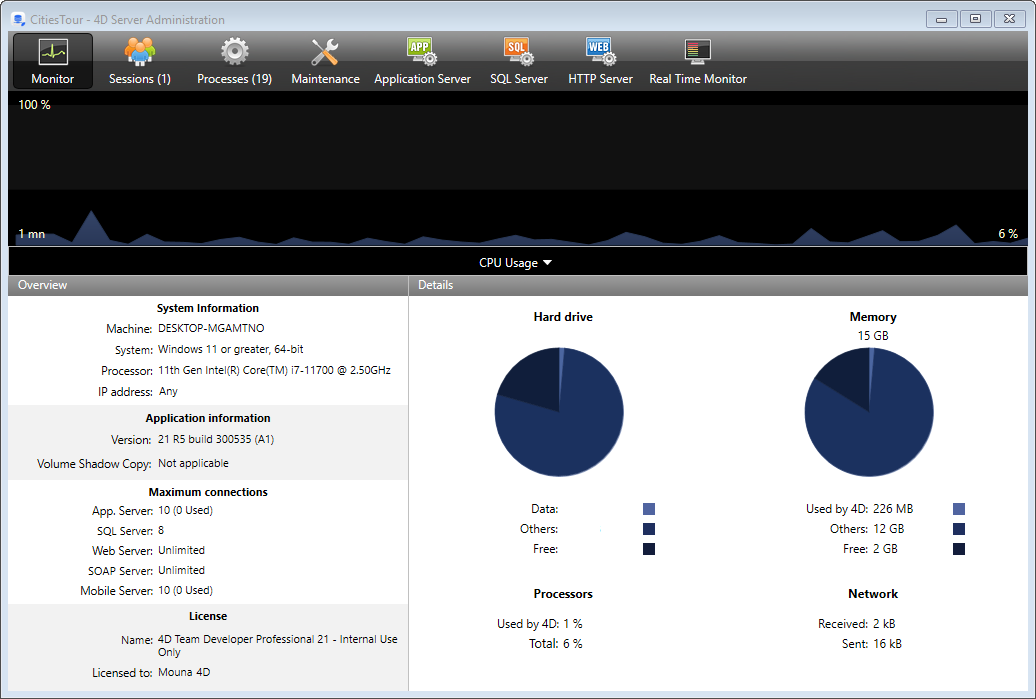
La página Monitor muestra información dinámica relativa al uso de la base de datos, así como información sobre el sistema y la aplicación 4D Server.
No Windows, algumas das informações do sistema exibidas nesta página são recuperadas através das ferramentas de "Analisador de desempenho do Windows". Estas ferramentas só podem ser acessadas quando o usuário que abriu a sessão onde o servidor 4D foi iniciado tiver a autorização administrativa necessária.
Área gráfica
A área gráfica permite que você veja a evolução em tempo real de vários parâmetros: o uso da CPU, o tráfego de rede e a memória. Você seleciona o parâmetro a ser exibido através de um menu encontrado no centro da janela:

- Uso de la CPU: uso global de la CPU de la máquina, para todas las aplicaciones en conjunto. A parte específica do servidor 4D nessa taxa de uso é fornecida na área de informação "Processadores".
- Red: número de bytes recibidos por segundo por la máquina (servidor o cliente). O número de bytes enviados é fornecido na área de informação "Rede".
- Memoria física: cantidad de memoria RAM de la máquina utilizada por 4D Server. Uma visão mais detalhada do uso de memória é fornecida na área de informação "Memória".
- Memoria virtual: cantidad de memoria virtual utilizada por la aplicación 4D Server. Esta memória é alocada pelo sistema conforme as necessidades de aplicação. O valor encontrado no canto inferior direito da área indica a quantidade de memória atualmente em uso. O valor encontrado no canto superior esquerdo indica a quantidade máxima de memória virtual utilizável. O valor máximo é calculado dinamicamente de acordo com as configurações gerais de memória da aplicação.
- Caché: cantidad de memoria caché utilizada por la aplicación 4D Server. O valor encontrado no canto inferior direito da área indica a quantidade de memória atualmente em uso. O valor encontrado no canto inferior direito da área indica a quantidade de memória atualmente em uso.
Observe que quando esta opção for selecionada, a rolagem da área do gráfico é desacelerada, uma vez que uma análise eficiente do cache é geralmente realizada por um período de observação bastante longo.
Área Visão geral
A área "Visão Geral" fornece várias informações sobre o sistema, aplicativo e licenças instaladas na máquina do servidor 4D.
- Información sistema: ordenador, sistema y dirección IP del servidor
- Información aplicación: número de versión interna de 4D Server y estado de Volume Shadow Copy
- Conexiones máximas: número de conexiones simultáneas permitidas por tipo de servidor
- Licencia: descripción de la licencia. Quando a licença do produto ou uma de suas expansões anexadas expirar em menos de 10 dias, por exemplo, em caso de uma licença de assinatura, o servidor 4D tenta renovar automaticamente a licença da conta de usuário 4D. Neste caso, se a renovação automática falhar por algum motivo (erro de conexão, status da conta inválido, contrato não prolongado. .), um ícone de aviso é exibido ao lado da licença para alertar o administrador do servidor. Informações adicionais sobre o status de renovação de licença podem ser exibidas em uma dica quando você passar o mouse sobre a área:
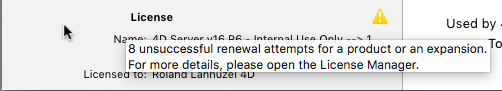
Usually, you will need to check the Licenses Manager.
Área Detalhes
A área de "Detalhes" repete parte das informações exibidas na área gráfica e fornece informações adicionais também.
- Disco duro: capacidad global del disco duro y distribución del espacio utilizado por los datos de la base de datos (archivo de datos + índice de datos), el espacio utilizado por otros archivos y el espacio libre disponible.
- Memoria: memoria RAM instalada en la máquina y cantidad de memoria utilizada por 4D Server, por otras aplicaciones o que está disponible. A memória usada pelo servidor 4D também pode ser exibida dinamicamente na área de gráficos.
- Procesadores: tasa instantánea de ocupación de procesador(es) de la máquina por 4D Server y por otras aplicaciones. Esta taxa é constantemente recalculada. A taxa de ocupação do Servidor 4D também pode ser exibida dinamicamente na área gráfica.
- Red: número instantáneo de bytes enviados y recibidos por la máquina (servidor o cliente). Este valor é atualizado constantemente. O número de bytes recebidos também pode ser exibido dinamicamente na área gráfica.